On Thursday 12 November 2026, Freddie Mac reported the average 30-year fixed mortgage at 7.11%. It was the fourth weekly fall in a row, the lowest in seven weeks, and the best news for home buyers in a month.
By Friday, it was gone. Mortgage News Daily’s daily index for top-tier 30-year loans hit 7.50% at the close on 13 November, up 0.32 points in three days. On a $300,000 loan, that is about $80 more a month.
Both numbers are real. They just measure different things, taken on different days. Here is what happened, what it costs, and what it means for your money.
The short answer
Freddie Mac’s Primary Mortgage Market Survey, released 12 November 2026, put the average 30-year fixed-rate mortgage at 7.11%, down from 7.18% the week before. The 15-year fixed fell to 6.45%, down from 6.57%. It was the fourth straight weekly decline, down from an early-October peak of 7.44%.
Then daily rates turned. A hotter-than-expected inflation report on Tuesday 10 November pushed the daily rate up, and by Friday 13 November the Mortgage News Daily index stood at 7.50%. By Monday 16 November it was 7.51%, and Bankrate’s national average stood at 7.28% for the 30-year fixed.
Quick decision guide:
- Buying a home now? Do not shop the 7.11% headline. Get written quotes from lenders. Your rate depends on your credit, down payment and loan size.
- Thinking about refinancing? The fall from the 7.44% peak saves about $67 a month on a $300,000 loan, but only if your own rate beats your current one by enough to cover closing costs.
- Waiting for rates to fall further? The three-day jump is a reminder that weekly averages can reverse fast. No one can say where they go next.
- Saving for a down payment? Keep saving. The rate moves the monthly payment, but the down payment is what you control.
Why two numbers disagree
Freddie Mac’s survey and the daily index are not the same measurement. Freddie Mac’s survey is weekly. It is based on Loan Product Advisor data, rates from thousands of loan applications submitted by lenders across the country, and it mostly captured the calmer early-week days before Tuesday’s inflation report.
The daily index caught the jump. When the inflation report came in hotter than expected on Tuesday 10 November, the daily rate rose 12 basis points in a single day, and it kept climbing through Friday. Mortgage News Daily described the move as erasing most of the improvement seen over the past five weeks.
That is the story of this week: a real four-week fall, then a sharp three-day reversal. The weekly survey is still the better picture of the trend. The daily index is the better picture of where rates stand right now.
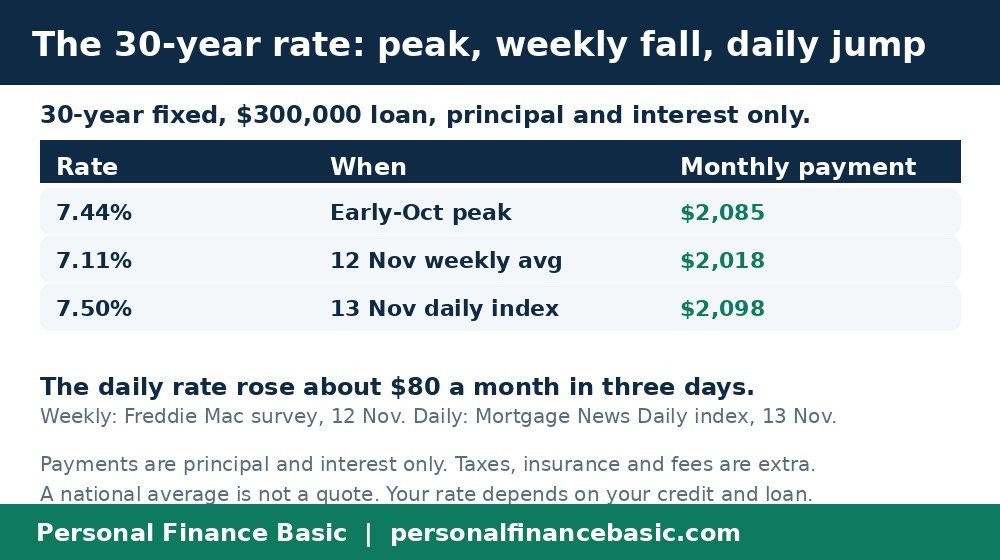
The 30-year rate: the October peak, the weekly fall, and the daily jump.
What the move costs on a real loan
Take a $300,000 loan, 30-year fixed, principal and interest only. At the early-October peak of 7.44%, the payment was $2,085 a month. At the 12 November weekly average of 7.11%, it was $2,018, about $67 less. At the 13 November daily rate of 7.50%, it was $2,098, about $80 more than the weekly figure.
On a $400,000 loan, the same move is bigger. At 7.11% the payment is $2,691 a month. At the 7.44% peak it was $2,780, about $90 more. These are principal and interest only. They leave out taxes, insurance, association dues, mortgage insurance and lender fees.
The 15-year loan moved the same way: 6.45% on 12 November, down from 6.57%, or $2,605 a month on a $300,000 loan. The daily 15-year index was 7.03% by Friday 13 November.
Rates are still above a year ago
Here is the part the headline hides. A year ago, the same Freddie Mac survey read 6.24% for the 30-year fixed. Today’s 7.11% is about 0.87 points above that. The fall from the October peak helps buyers, but mortgages are not cheap. Say that plainly: a $300,000 loan at 7.11% costs $2,018 a month in principal and interest, about $173 more than the same loan would have cost a year ago at 6.24%.
Your own rate will not be 7.11% or 7.50%. Both are national averages for conventional, conforming home-purchase loans for borrowers who put 20% down and have excellent credit. Your rate depends on your credit score, your down payment, the loan amount, the property type and the lender. Compare written quotes, and compare them on the same day.
What the Fed does and does not do
The Federal Reserve does not set mortgage rates. The closer driver is the 10-year Treasury yield. That is why one inflation report could push daily mortgage rates up in a day while the Fed did nothing at all.
Do not expect a December Fed move to move mortgages in a straight line either. The Fed sets a short-term rate. Mortgages follow the long end of the bond market, and the two do not always move together.
The next Freddie Mac survey comes out on Thursday 19 November at noon Eastern. That will be the next weekly reading, and it will show whether the daily jump was a blip or the start of a new climb.
At a glance
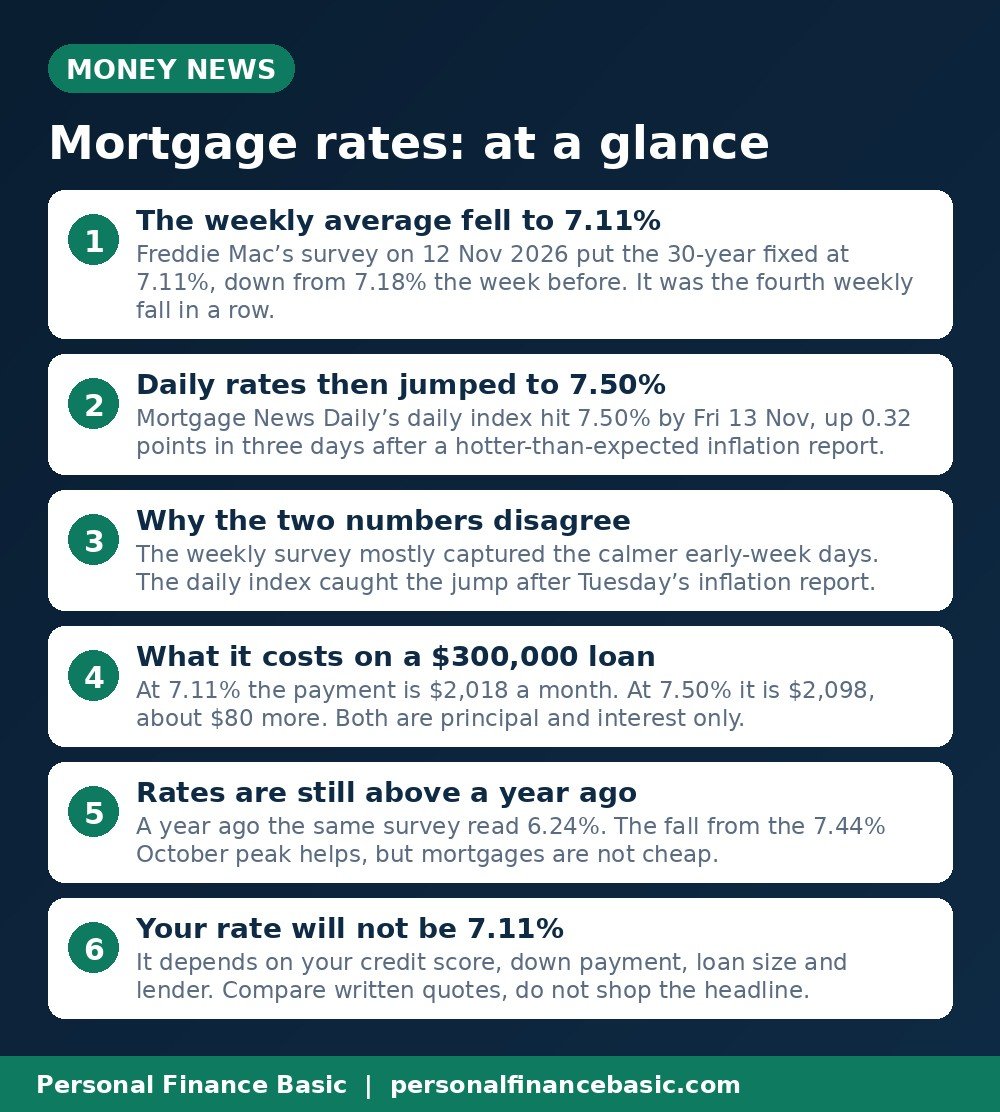
The main points from this guide, in one picture.
Frequently asked questions
Which rate should I believe, 7.11% or 7.50%?
Both, for different things. Freddie Mac’s 7.11% is the weekly average for the week ending 12 November. The 7.50% daily index shows where top-tier rates stood after the inflation report. Neither is a quote for you.
How much does the rate move my monthly payment?
On a $300,000, 30-year loan, the gap between 7.11% and 7.50% is about $80 a month in principal and interest: $2,018 versus $2,098. Taxes, insurance and fees are extra.
Should I wait for rates to fall before buying?
There is no safe answer. Rates fell for four weeks, then jumped 0.32 points in three days. Waiting can save money or cost money, and nobody knows which. Buy when the payment fits your budget and you plan to stay put, not when a headline tells you to.
Does a Fed rate move change mortgage rates?
Not directly. The Fed sets a short-term rate, while mortgages follow the 10-year Treasury yield and the bond market. A Fed move can push mortgage rates either way, depending on what the bond market expected. The inflation report this week moved rates more than any Fed action did.
The bottom line: mortgage rates fell to 7.11% in the week to 12 November, then jumped to 7.50% in three days after a hot inflation report. The fall from the October peak is real, and so is the reversal. Get written quotes, compare them on the same day, and buy when the payment fits.
This post is general education, not financial or tax advice. Rates change daily, and your own rate depends on your credit, down payment and loan.
Related reading: How to Automate Your Savings on Payday and The 50/30/20 Rule With US Examples ($3,000 a Month)